


The Evidence Ledger
From Data to Decisions: How Visualizations Transform Financial Investigations
Accountants and government investigators share a common challenge when they embark on a financial investigation: too much data, and not enough clarity. Whether unraveling fraud, tracing illicit funds, creating a restructuring plan, or preparing evidence for court, the ability to see the story behind the numbers is what separates slow, fragmented investigations from efficient, defensible results.
That’s where advanced visualizations come in. Data, on its own, can be overwhelming. But when transformed into clear narratives, visualizations allow professionals to cut through complexity, uncover hidden patterns, and communicate findings with precision.
At Valid8, we’ve designed our visualization suite specifically for professionals in accounting, forensic accounting, and government investigations—helping them turn raw financial records into actionable insights.
Why Visualizations Matter in Financial Investigations
Traditional investigation methods rely heavily on spreadsheets and manual reconciliations, and timelines often don’t allow for an analysis of all of the available data. While these tools have served the profession for decades, they simply can’t keep pace with the sheer volume and complexity of modern financial activity.
Visualizations solve this by:
- Making anomalies visible – Suspicious transfers, irregular use of funds, and hidden accounts stand out instantly.
- Connecting the dots faster – Flow diagrams reveal how money moves from sources to uses, across accounts and entities.
- Telling a defensible, engaging story – Courtroom-ready visuals help judges, juries, and stakeholders intuitively understand complex fund movements.
For professionals under pressure to deliver speed, accuracy, and defensibility, visualizations are no longer optional—they’re essential.
The Core Visualization Types That Drive Results
Our visualization suite was built around the workflows of accountants, investigators, and fiduciaries. Key options include:
Dashboards & Overviews – Provide executives and case managers with high-level summaries of financial activity, highlighting areas of concern.

Trend & Time-Series Charts – Reveal how cash flows evolve over time, surfacing unusual spikes or declines that merit deeper review.

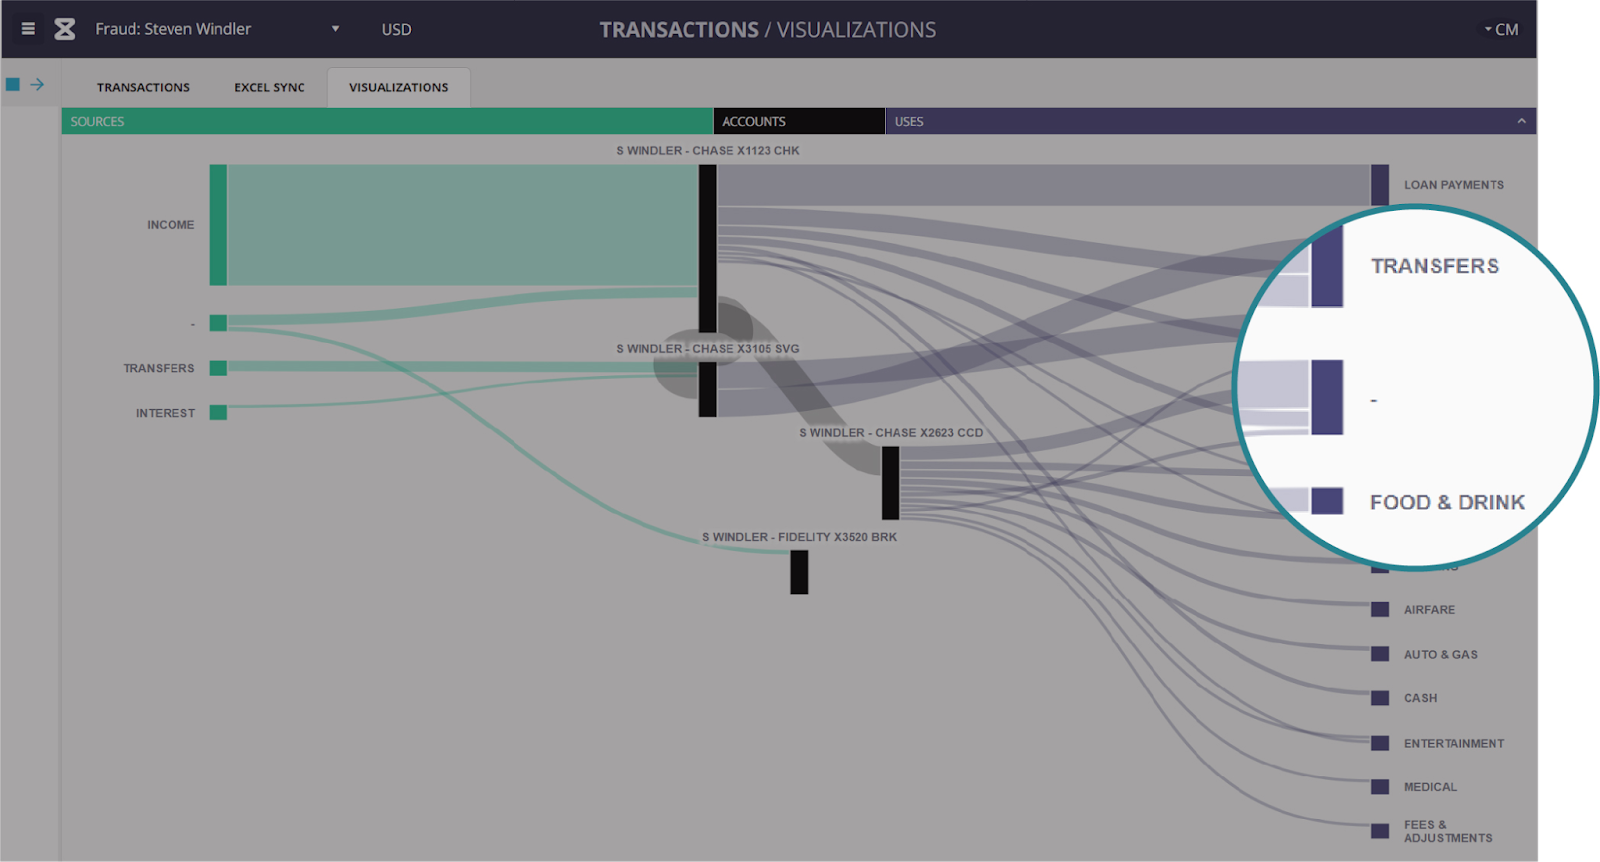
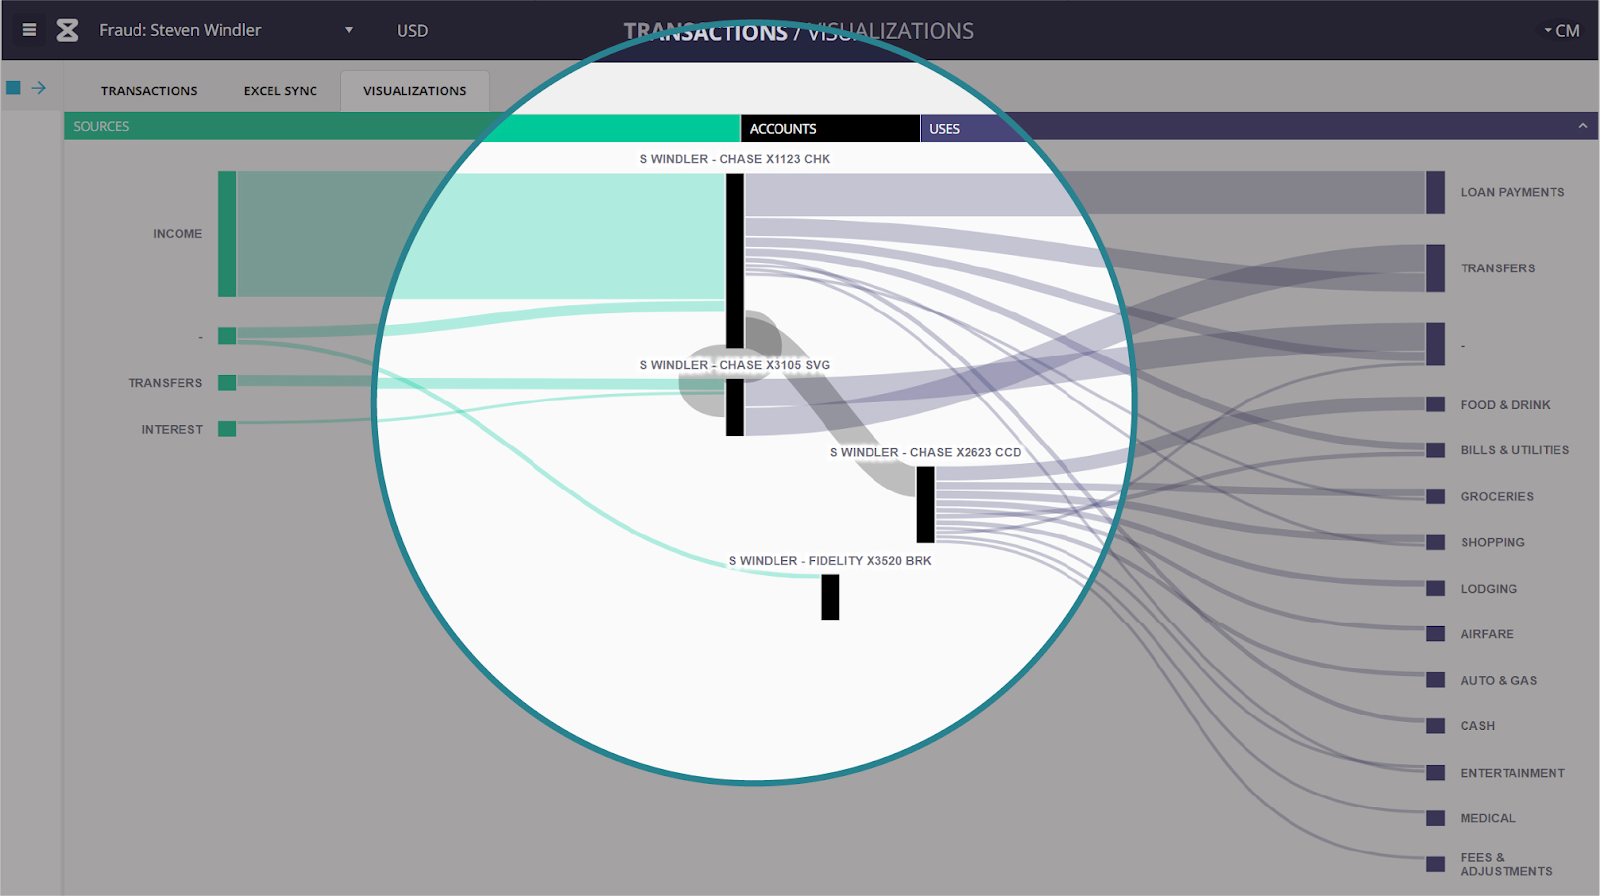
Hierarchical & Relationship Visualizations – Use Sankey diagrams and flow charts to illustrate how funds move between entities or accounts.
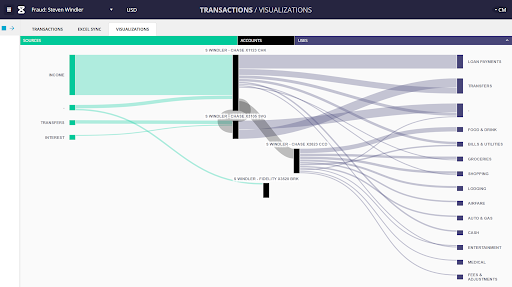
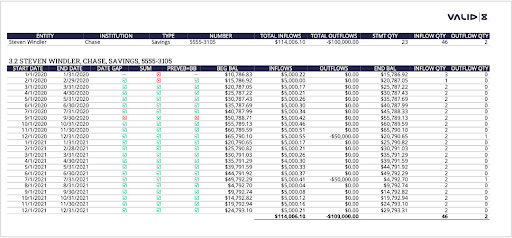
Customizable & Interactive Views – Allow professionals to filter, drill down, and tie every transaction back to the original bank statement, check, or deposit slip.

Example of a customized view, where you can click to see original source material
These aren’t just static charts. They’re interactive tools designed to uncover the story behind the numbers, quickly and defensibly.
Tailoring Visualizations to Real-World Use Cases
Different investigative contexts demand different visualization strategies. Here’s how they play out across the most common use cases.
Forensic Investigations
Forensic accountants working on embezzlement, insurance fraud, or matrimonial lifestyle analyses often juggle fragmented financial data. Technology can automatically reconcile statements, match checks to deposits, and categorize transactions. Fund flow diagrams then bring this all to life – missing or incorrect data and even possible undisclosed accounts are flagged visually. The result: cases that once took months to prepare can now be advanced in days, with every finding tied back to the original source material.
Financial Crime
Government investigators pursuing money laundering, Ponzi schemes, or trafficking cases often face the challenge of scale: millions of transactions across multiple institutions and currencies. Advanced visualizations compress that workload by instantly mapping transfers, highlighting suspicious activity, and creating courtroom-ready narratives. Tools like the Financial Activity Report (FAR) ensure every visualization is tied back to admissible evidence, giving prosecutors confidence in building stronger cases.
Bankruptcy & Restructuring
Trustees and fiduciaries tasked with navigating bankruptcies and restructurings need rapid clarity on financial realities. Visualizations reveal intercompany transfers, and trends that point to possible preference payments or fraudulent activity. Trended statements of cash provide both historical insight and forward-looking forecasts, enabling more accurate recovery strategies for creditors. With these tools, fiduciaries can fulfill their responsibilities faster and with greater confidence.
Expert Witness Testimony
Visualizations expose financial patterns and spending behaviors, and for those preparing to give expert witness testimony, they go one step further—turning dense accounting records into clear, visual narratives that judges and juries can easily understand. By linking every visual back to original evidence, professionals not only strengthen testimony but also eliminate doubt about data integrity.
Beyond the Chart: Storytelling With Data
Numbers alone don’t persuade—stories do. That’s why every visualization in our platform ties back to a clickable, downloadable Financial Activity Report (FAR), which indexes each transaction to its original evidence – bank and brokerage statements, accounting data, checks, and deposit slips. This ensures that the visualizations aren’t just visually compelling but also legally defensible.
For investigators and accountants alike, this means they can:
- Build trust with clients, district attorneys, regulators, and courts.
- Present complex cases in ways non-experts can understand.
- Move seamlessly from high-level visuals to individual transactions when challenged.
In other words, visualizations become more than graphics—they become evidence-backed stories that drive decisions.
The Future of Financial Investigations Is Visual
As financial fraud and crime grow more complex, professionals must equip themselves with tools that match the scale of the challenge. Visualizations don’t just make data easier to digest—they accelerate investigations, strengthen outcomes, and reduce risk.
For forensic accountants and government investigators, the message is clear: the future of your work isn’t in endless spreadsheets. It’s in seeing the story your data is trying to tell.
Interested in exploring how visualization can transform your investigations?
Related Resources


Related Resources


Related Resources


Need to prepare evidence? Help your team follow the flow of funds faster.
Use Cases


